LSTM与Prophet时间序列预测实验
分别使用Pytorch构建的LSTM网络与Facebook开源的Prophet工具对时间序列进行预测的一个对比小实验,同时作为一个小白也借着这个实验来学习下Pytorch的使用,因为第一次使用,所以会比较详细的注释代码。
使用的数据为了与Prophet进行对比,因此使用了Prophet官网例子上用到的数据集。该时间序列数据集来自维基百科上面对美国橄榄球运动员佩顿·曼宁(Peyton Williams Manning)的日访问量的记录日志,时间跨度为2007年12月10号到2016年1月20号共2905条数据。
Jupyter代码与数据集地址在我的github上,欢迎star。
LSTM
LSTM的介绍参考夕小瑶与陈诚的介绍,代码主要参考凌空的桨与源码链接 ,在Pytorch1.3.1的版本上面改了一下,主要是测试的逻辑修改成了使用测试集以及取消了Variable的使用。整体的逻辑是使用前面的两天的数据来预测下一天的数据,网络的结构是使用了两层LSTM与一层线性回归层。
数据预处理
首先是数据的预处理代码如下:
1
2
3
4
5
6
7
8
9
10
11
12
13
14
15
16
17
18
19
20
21
22
23
24
25
26
27
28
29
30
31
32
33
34
35
36
37
38
39
40
41
42
43
44
45
46
47
48
49
| import numpy as np
import pandas as pd
import matplotlib.pyplot as plt
import torch
from torch import nn
data = pd.read_csv('example_wp_log_peyton_manning.csv',usecols=[1])
data = data.dropna()
dataset = data.values
dataset = dataset.astype('float32')
max_value = np.max(dataset)
min_value = np.min(dataset)
scalar = max_value - min_value
dataset = list(map(lambda x: x/scalar, dataset))
def create_dataset(dataset,look_back=2):
dataX, dataY=[], []
for i in range(len(dataset)-look_back):
a=dataset[i:(i+look_back)]
dataX.append(a)
dataY.append(dataset[i+look_back])
return np.array(dataX), np.array(dataY)
data_X, data_Y = create_dataset(dataset)
train_size = int(len(data_X) * 0.7)
test_size = len(data_X)-train_size
train_X = data_X[:train_size]
train_Y = data_Y[:train_size]
test_X = data_X[train_size:]
test_Y = data_Y[train_size:]
train_X = train_X.reshape(-1,1,2)
train_Y = train_Y.reshape(-1,1,1)
test_X = test_X.reshape(-1,1,2)
train_x = torch.from_numpy(train_X)
train_y = torch.from_numpy(train_Y)
test_x = torch.from_numpy(test_X)
|
LSTM网络构建
接着定义好网络模型,模型的第一部分是一个两层的 RNN,每一步模型接受前两天的输入作为特征,得到一个输出特征。接着通过一个线性层将 RNN 的输出回归到流量的具体数值,这里我们需要用 view 来重新排列,因为 nn.Linear 不接受三维的输入,所以我们先将前两维合并在一起,然后经过线性层之后再将其分开,最后输出结果。
1
2
3
4
5
6
7
8
9
10
11
12
13
14
15
16
17
18
19
20
21
22
|
class lstm_reg(nn.Module):
def __init__(self,input_size,hidden_size, output_size=1,num_layers=2):
super(lstm_reg,self).__init__()
self.rnn = nn.LSTM(input_size,hidden_size,num_layers)
self.reg = nn.Linear(hidden_size,output_size)
def forward(self,x):
x, _ = self.rnn(x)
s,b,h = x.shape
x = x.view(s*b, h)
x = self.reg(x)
x = x.view(s,b,-1)
return x
net = lstm_reg(2,4)
net = net.cuda()
criterion = nn.MSELoss().cuda()
optimizer = torch.optim.Adam(net.parameters(),lr=1e-2)
|
本来打算把网络拓扑也给画出来的,后面发现自己理解的还不够深入,可以先参考LSTM神经网络输入输出究竟是怎样的? - Scofield的回答 - 知乎 和LSTM细节分析理解(pytorch版) - ymmy的文章 - 知乎
关于forward函数中为什么每个层可以直接使用输入的数据x这个tensor,而不需要按照构造函数里面的按照形参(input_size,hidden_size,num_layers)来传递参数。以nn.LSTM做例子,官方API为:
- 参数
– input_size
– hidden_size
– num_layers
– bias
– batch_first
– dropout
– bidirectional
- 输入
– input (seq_len, batch, input_size)
– h_0 (num_layers num_directions, batch, hidden_size)
– c_0 (num_layers num_directions, batch, hidden_size)
输出
– output (seq_len, batch, num_directions hidden_size)
– h_n (num_layers num_directions, batch, hidden_size)
– c_n (num_layers * num_directions, batch, hidden_size)
所以forward中的x,x, _ = self.rnn(x)传递的参数是对应输入input (seq_len, batch, input_size)这个tensor,而不是对应的参数列表。同样_所代表的参数也就是h_n 和c_n。
迭代
迭代过程进行了10000次迭代:
1
2
3
4
5
6
7
8
9
10
11
12
13
14
15
16
17
18
19
| for e in range(10000):
var_x = train_x.cuda()
var_y = train_y.cuda()
out = net(var_x)
loss = criterion(out, var_y)
optimizer.zero_grad()
loss.backward()
optimizer.step()
if (e+1)%100 == 0:
print('Epoch: {}, Loss:{:.5f}'.format(e+1, loss.item()))
torch.save(net.state_dict(), 'example_wp_log.net_params.pkl')
|
测试过程
在测试的时候我发现源码中并没有用到之前划分的30%的测试集来单独进行测试,而是直接把原来的完整数据给丢进去来训练的,这儿有点没搞懂。因为按理来说需要单独使用测试集进行测试来评判模型的性能的,所以我单独把测试的数据集给提出来,使用单独的测试集进行了测试。
1
2
3
4
5
6
7
8
9
10
11
12
13
14
15
16
17
18
19
20
21
22
23
24
| net.load_state_dict(torch.load('example_wp_log.net_params.pkl'))
var_data = torch.from_numpy(test_X).cuda()
pred_test = net(var_data)
pred_test = pred_test.cpu().view(-1).data.numpy()
origin_test_Y = test_Y*scalar
origin_pred_test = pred_test*scalar
plt.plot(origin_pred_test, 'r', label='prediction')
plt.plot(origin_test_Y, 'b', label='real')
plt.legend(loc='best')
plt.show()
true_data = origin_test_Y
true_data = np.array(true_data)
true_data = np.squeeze(true_data)
MSE = true_data - origin_pred_test
MSE = MSE*MSE
MSE_loss = sum(MSE)/len(MSE)
print(MSE_loss)
|
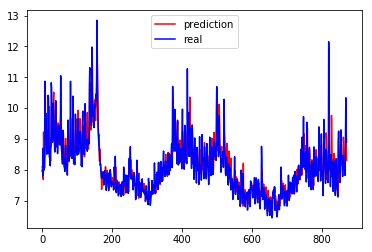
计算出来的MSE为0.195649022176008, 画出来的曲线图为:

GPU加速
use_gpu = torch.cuda.is_available() # 判断是否有GPU加速
CUDA 加速需要设置的为:
- 迭代的过程中输入的tensor放到GPU上 var_x = train_x.cuda()
- 模型转移到GPU net.cuda()
- 损失函数转移到GPU criterion = nn.MSELoss().cuda()
Prophet
Prophet是facebook开源的一个时间序列预测工具,使用了时间序列分解与机器学习拟合的方法。详细介绍参考张戎的介绍。
Prophet的安装
在安装Prophet的时候并没有想官网介绍的那么简单,首先需要先安装Pystan,但是直接pip install pystan会报编译器内部错误,使用conda install -c conda-forge pystan之后问题解决,然后再使用pip install fbprophet 进行安装。
实验
实验的例子就是官网的例子
1
2
3
4
5
6
7
8
9
10
11
12
13
14
15
16
17
18
19
20
21
22
23
24
| import pandas as pd
from fbprophet import Prophet
df = pd.read_csv('example_wp_log_peyton_manning.csv')
m = Prophet()
m.fit(df)
future = m.make_future_dataframe(periods=365)
forecast = m.predict(future)
forecast[['ds', 'yhat', 'yhat_lower', 'yhat_upper']].tail()
plt.plot(fb_pre, 'r', label='prediction')
plt.plot(origin_test_Y, 'b', label='real')
plt.legend(loc='best')
plt.show()
fb_pre = np.array(forecast['yhat'].iloc[2034:2905])
MSE = true_data - fb_pre
MSE = MSE*MSE
MSE_loss = sum(MSE)/len(MSE)
print(MSE_loss)
|
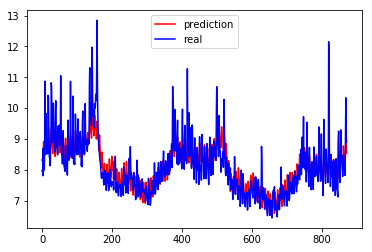
计算出来的MSE为:0.25229994660830146,画出来的图像为:

总结
| 方法 |
MSE |
| LSTM |
0.195649022176008 |
| Prophet |
0.25229994660830146 |
可以看到使用LSTM的预测结果要比Prophet的结果好,但是也有可能是我还没有去调整Prophet的参数导致Prophet的性能差一些的。同时Prophet可以预测整整一年的时间,这个比起使用LSTM要厉害很多,实验中的LSTM使用的是单步预测的方法,也就是只能根据前段时刻的数据来预测下一个时刻的数据,如果要做到像Prophet那样预测未来一段时刻的数据,需要使用多步预测的方法,我查了下涉及到seq2seq,貌似比较复杂,还没有做实验。
自己是小白,实验可能存在相关问题与不足之处,欢迎反馈。
参考
Pytorch中的LSTM参数
Prophet官网
Prophet安装问题


